In October 2007, General Electric looked about as far from a gamble as a stock could. Light bulbs, jet engines, a dividend paid for decades.
Over the next seventeen months it fell 82.7%.
Along the way it passed through exactly the moment the slogan is built for. By January 2008 GE was already down 20% from its high - a great company, visibly on sale. Exactly the moment the slogan tells you to buy.
It then fell another 78% below that price.
And here is the part nobody expects: the slogan was not wrong. GE got back to even. An investor who bought at the very top, and reinvested every dividend along the way, was whole again in December 2015 - eight years and three months later.
A dollar put into a plain S&P 500 index fund on the day GE peaked had grown to $1.60 by that same date. And the person who bought GE in January at that visible 20% discount finished with $1.27, against $1.84 for the same money put into the index on that same January day.
Getting back to even was never the question. The question is what those eight years cost.
Two different claims wearing one name
That is the trouble with "buy the dip." It sounds like one piece of advice, but it is two, and they need separate answers.
The first is about timing: don't put your money in now - wait for prices to fall, then buy. The second is about faith: when prices do fall, buy, because it always comes back.
We tested both against 19 years of US market data. Neither survives in the form people repeat it.
Does waiting for a crash actually pay?
You have some money. The market looks expensive. Every instinct says wait for a pullback and buy in cheaper.
So let's run it. Two people have the same lump sum on the same day. The first buys an S&P 500 index fund immediately and holds. The second parks the money in Treasury bills - real interest, not a mattress - and waits for the market to fall a set distance below its high. When it does, they buy at the next day's close, because a closing price isn't something you can trade on until it has happened. Then both hold to the end.
We ran that for every trading day between May 2007 and July 2026 as a possible starting date. All 4,819 of them, so the answer doesn't hang on one lucky guess about when to begin.
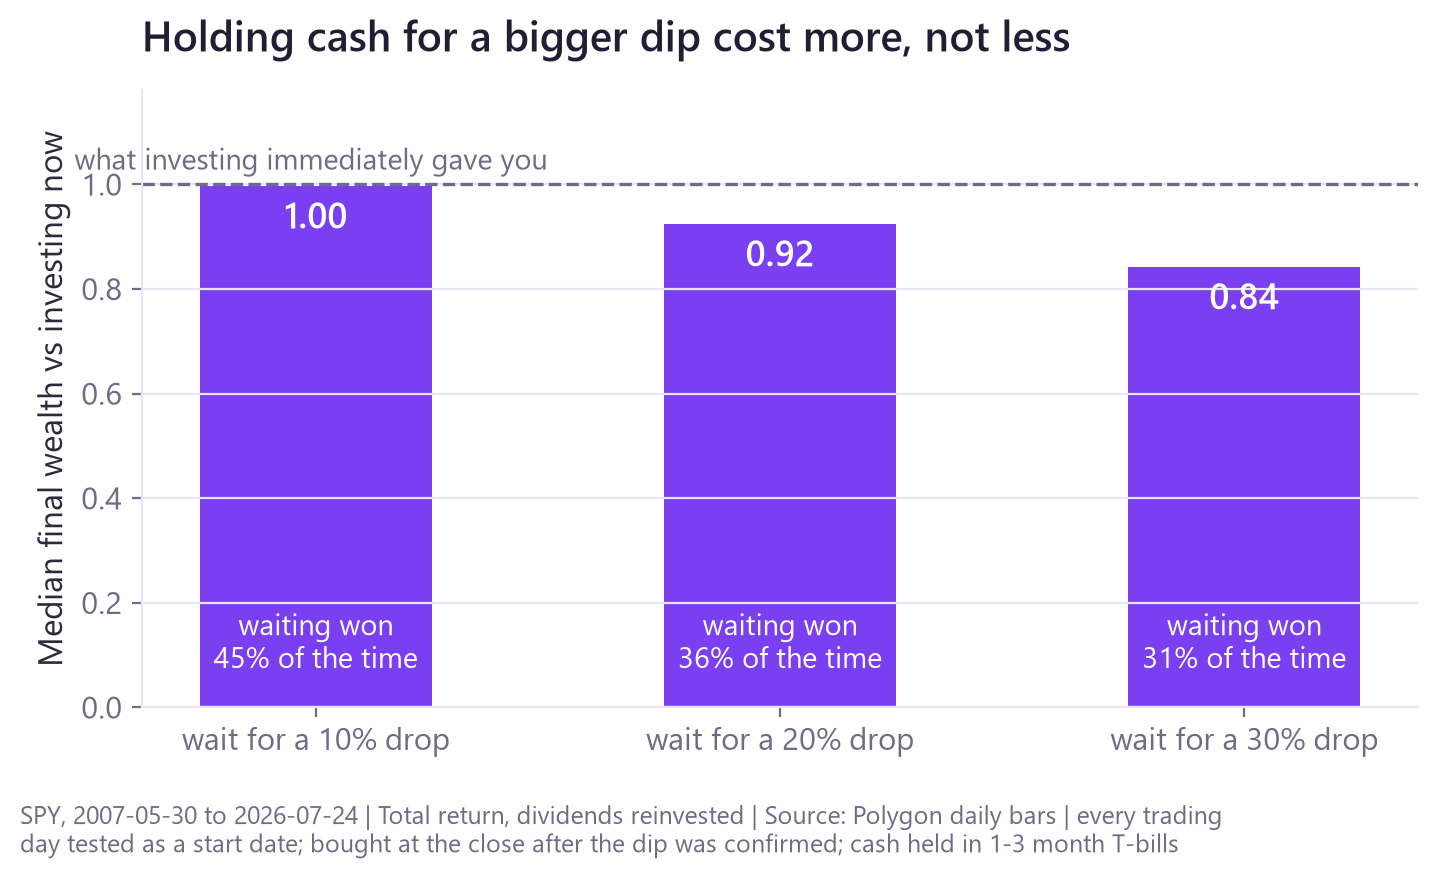
Waiting for a 10% dip was close to a coin flip: it came out ahead on 45% of start dates, behind on 54%, and effectively tied on the handful left over. The typical outcome was a hair below just buying.
Waiting for a 30% dip left the typical investor with 84 cents for every dollar the immediate buyer ended up with, and it won on only 31% of start dates.
Look at the shape of that, because it is the opposite of what you would guess. Across all three thresholds we tested, holding out for a bigger drop made the typical outcome worse, not better. The version that feels rigorous, the version that feels like patience, was the version that cost the most.
The reason isn't complicated. Across this whole sample, cash returned about 1.37% a year and the market returned 10.58%. That gap didn't apply evenly - there were long stretches, 2008 above all, when cash was the better place to be - but averaged over 19 years, long waits were expensive.
And the waits were long.
| If you waited for | Typical wait before it arrived | Start dates where it never arrived |
|---|---|---|
| a 10% drop | 4 months | 313 of 4,819 |
| a 20% drop | 17 months | 927 of 4,819 |
| a 30% drop | 3 years, 4 months | 1,592 of 4,819 |
That last column is the part the slogan never mentions. Those start dates never produced the crash being waited for, and the money was still sitting in cash when the test ended.
Now the honest part: waiting still won on a large minority of start dates - 45% at the 10% threshold, 36% at 20%, 31% at 30%. Hold cash in the summer of 2007 and you were rewarded for it. The catch is that you would have to know in advance which start dates those were, and the rule gives you no way to identify them.
But doesn't it always come back?
For the market as a whole, over this window, it did. The S&P 500 fell 55.2%, and an investor reinvesting dividends was back to break-even in under five years. (On price alone, ignoring dividends, it took about five and a half.) Anyone who bought during the worst of 2009 and held on did very well. No honest reading of the data says otherwise.
But notice what is doing the work there, because it isn't the dip and it isn't the buying. An index fund spreads your money across hundreds of companies, so no single failure can sink you. The index also changes its constituents over time - not to pick future winners, but to keep representing the large-company market as that market changes. Shareholders still absorb the losses of failing members while they are still in the index.
That is a real advantage, and it is worth being precise about what kind. Diversification limited how much damage any one GE could do to you. It did not make recovery inevitable, and nothing does.
Point the same slogan at a single company and that protection is gone.
There is also a failure mode the slogan sets up that nothing here measures. You buy something at what looks like a discount. It falls further. Now you have a choice: admit you were early, or buy more and bring your average down. The slogan is right there telling you which one a disciplined investor does. Follow it twice and you are further down than when you started, concentrated in one company, and calling it conviction. We did not test how often people do that. What we can say is that nothing in the slogan warns you away from it.
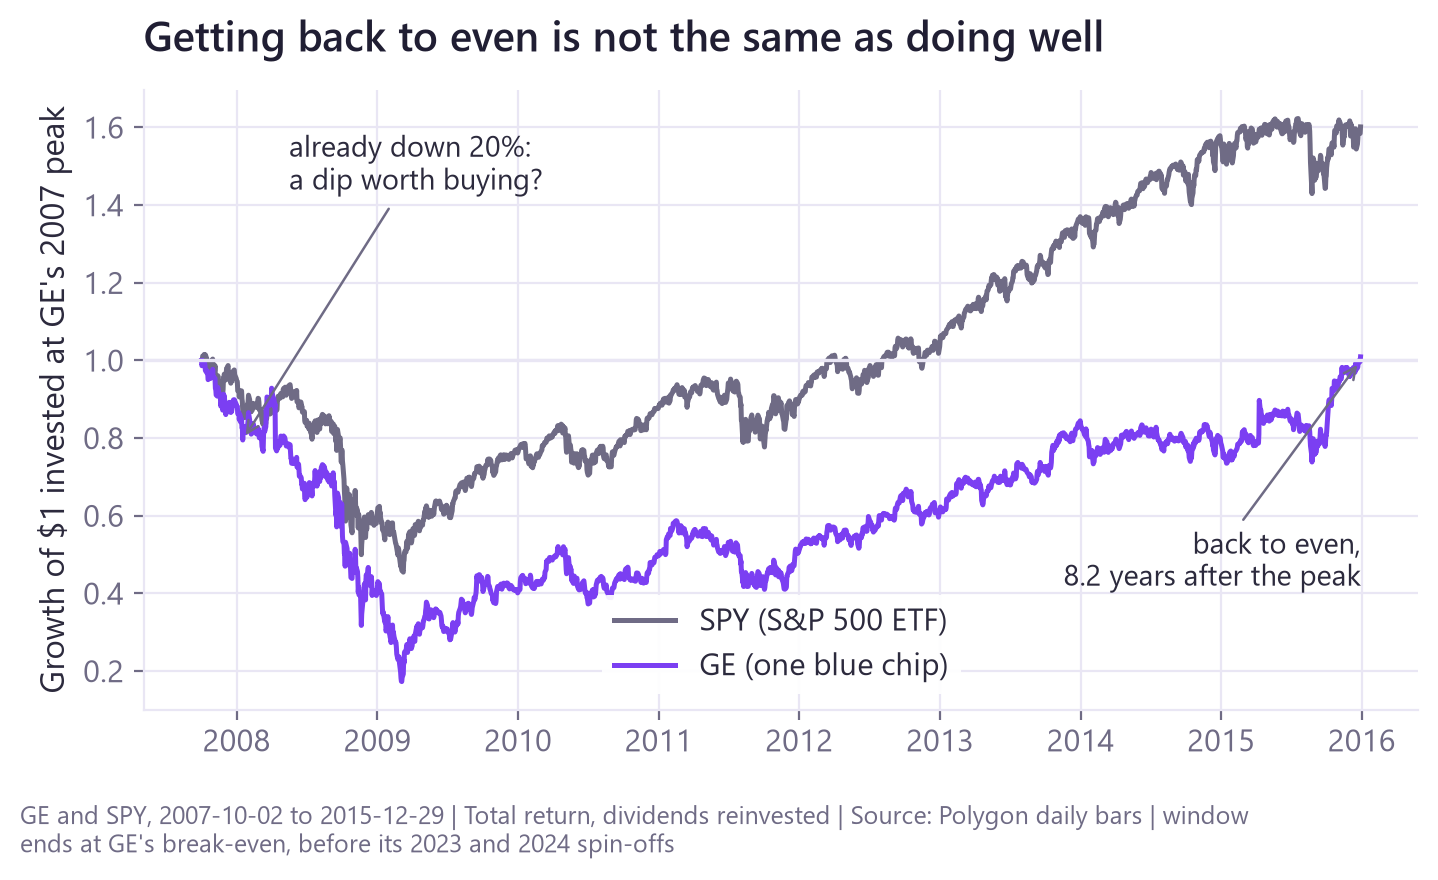
The gray line is the market. The purple line is the great company on sale.
"It came back" and "you were fine" are not the same sentence. In GE's case the cost that mattered was not the loss on the screen, which did eventually close. It was the eight years of index growth that money didn't earn while it waited to be proved right.
So what should you actually ask?
As people usually say it, "buy the dip" isn't a complete strategy. It doesn't say what to buy, how far a price has to fall, how much to put in, or what to do if it keeps falling - and that last one is where the money is actually made or lost.
Take the slogan apart and what's left is a more boring pair of questions.
Does this thing have a reason to recover that doesn't depend on one company getting its act together? A broad index doesn't rely on any single business surviving. A single stock needs a specific management team to fix a specific problem, and sometimes they don't.
Can you afford to be wrong for years? Not months. Someone who bought GE at the October 2007 peak and reinvested every dividend waited eight years and three months to get back to even, and that is what actually happened, not some worst case.
Those questions do real work. "Is this a dip?" doesn't - not because you can't see it, but because seeing it isn't the hard part. You can observe a 20% drawdown today. Whether it was a temporary dip or the start of a decade of damage is something you only learn later.
Where we could be wrong
Every backtest is an argument about one slice of history, so here is ours.
We used SPY, the fund that tracks the S&P 500, rather than the index itself, because you can actually buy the fund. The waiting money sits in BIL, the fund that holds 1-3 month Treasury bills, for the same reason: it is one realistic, buyable proxy for cash, and its fee is a real cost. That fee counts against waiting, and waiting is the side we come down against, so we re-ran the whole test with the fee added back and more besides. The 30% result moved from 84 cents to 85. It is not carrying the argument. All returns include dividends reinvested: over this window that's 10.58% a year with them and 8.55% without, which is most of the reason the distinction matters.
Our data starts in May 2007 and misses the 2000-2002 dot-com collapse entirely. That period would probably have made waiting look better, because it contained a long stretch where cash beat stocks. Our answer on the timing half is a statement about this window, not a law of nature.
The 4,819 start dates are also heavily overlapping - consecutive days share almost all of their history - so they are not 4,819 independent experiments. They show how the rule behaved across one nineteen-year path, not how it would behave across nineteen unrelated ones.
The GE comparison stops in December 2015 on purpose. GE later spun off GE HealthCare and GE Vernova, and shareholders received shares in both. Carrying a single GE price line past those events would quietly assume something about what holders did with the new shares, so we end the comparison before them rather than publish a number resting on an assumption we never stated.
GE is also one company, picked because it is the famous case. It shows that a blue chip can stay underwater for the better part of a decade. It does not tell you how often that happens, and we haven't tested that here.
Finally, no taxes or trading costs are counted, and the whole thing assumes a lump sum sitting ready to invest. Many people are investing out of a paycheck instead, which is a genuinely different question - and the next piece in this series.
Bottom line
Slogans like this one survive because their wins are vivid and their costs are invisible. Nobody tells the story of the eight years they spent getting back to even, or the three years they sat in cash waiting for a crash that never came. Those aren't stories. They're just a smaller number at the end.
The useful move with any rule this popular isn't to obey it or dismiss it. It's to ask what it is actually claiming, and then check whether that claim is true of the thing in front of you. Half of "buy the dip" is a timing bet this data doesn't support. The other half isn't about dips at all: what did the work here was owning hundreds of companies instead of one, in a costume that makes it sound like a lesson about when to buy.
Back to the Blog · Explore the Learn hub
This content is provided by BogaTrade for educational and informational purposes only. It is not financial, investment, tax, or legal advice, and it is not a recommendation to buy or sell any security or to adopt any investment strategy. Any securities or strategies mentioned are used only to illustrate concepts. Investing involves risk, including possible loss of principal, and past performance does not guarantee future results. Do your own research and consider consulting a licensed financial advisor before making any investment decision.